
Georgia’s 2014 Foreign Trade
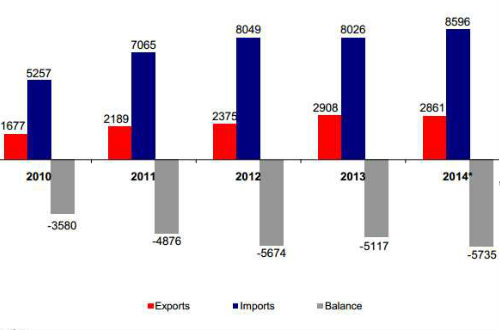
Georgia’s foreign trade figures in 2010-2014 in million U.S. dollars. Source: Geostat
Georgia’s foreign trade increased 5% year-to-year in 2014 to USD 11.45 billion with trade gap increasing 12% y/y to USD 5.7 billion, according to preliminary data released by the state statistics office, Geostat, on January 21.
Imports increased 7% y/y in 2014 to USD 8.59 billion, according to the preliminary data.
Exports from Georgia declined by 1.62% in 2014 compared to previous year to USD 2.86 billion, caused mostly by decreasing re-export of vehicles.
Although exports showed upward trend in the first half of 2014, it started declining on yearly basis from August.
There was 6.1% y/y decline in exports in the third quarter of 2014 and it further dipped by 20.5% in final three months of 2014, compared to same period of previous year.
Turkey remains Georgia’s largest trading partner with total turnover of USD 1.96 billion in 2014, a 23.5% y/y increase. Imports from Turkey went up by 22.6% y/y to USD 1.72 billion and Georgian exports to Turkey increased 30.8% y/y to USD 239.3 million in 2014.
Although trade turnover declined with Azerbaijan in 2014 to USD 1.18 billion, it still remains Georgia’s second largest trading partner. Imports from Azerbaijan (oil products and hydrocarbons make bulk of these imports) declined 2.3% y/y to USD 637.5 million and exports to Azerbaijan were down by 23.3% y/y to USD 544.4 million – decrease is mainly attributed to declining re-export of vehicles to Azerbaijan.
Russia, which was Georgia’s fourth largest trading partner in 2013, moved to third place last year with total turnover of USD 852.6 million, a 9.5% y/y increase, accounting for 7.4% of Georgia’s foreign trade.
Imports from Russia declined by 1.7% y/y to USD 577.7 million in 2014, attributed mainly to decrease of import of oil and oil products. Wheat accounted for up to 30% of imports from Russia.
Georgian exports to Russia reached USD 274.9 million, a 44.1% y/y increase, accounting for 9.6% of Georgia’s total exports in 2014.
Russia is Georgia’s third largest exporting market after Azerbaijan and Armenia.
Wine represents major Georgian export to Russia. Value of exported wine to Russia almost doubled to USD 111.4 million in 2014; export of mineral waters also doubled to USD 66.3 million last year.
China is Georgia’s fourth largest trading partner with turnover of USD 823.3 million in 2014 with imports amounting to USD 732.9 million and exports to USD 90.3 million.
Ukraine, which was Georgia’s third largest trading partner in 2013, is on the fifth place with total turnover of USD 686.3 million in 2014. Georgian exports declined by 27.2% y/y to USD 140.2 million in 2014 and imports were down by 9.4% y/y to USD 546.1 million.
Ukraine is followed by Germany with total trade turnover of USD 534.9 million in 2014; Armenia – USD 498.5 million; the United States – USD 494.8 million; Bulgaria – USD 373.8 million; Japan – USD 371.4 million.
Georgia’s trade turnover with the EU-member states amounted to USD 2.99 billion in 2014, a 4% y/y increase, accounting for 26% of country’s total trade turnover.
Georgia’s exports to EU-member states reached USD 621 million in 2014, a 2% y/y increase, accounting for 22% in Georgia’s total exports. Import from the EU increased by 4% y/y to USD 2.36 billion in 2014.
Trade with Commonwealth of Independent States (CIS) declined by 5% y/y to USD 3.59 billion in 2014, accounting for 31% of Georgia’s total trade. Exports to CIS-member states were down by 10% y/y to USD 1.46 billion, accounting for 51% of Georgia’s total exports. Import from CIS-member states declined by 2% y/y to USD 2.12 billion in 2014.
Re-export of cars lead the pack in Georgia’s total exports with USD 517.7 million (26.4% y/y decline) in 2014, followed by ferroalloys with USD 285.7 million (24.2% y/y decline); copper ores and concentrates – USD 248 million (53.4% y/y increase); hazelnut – USD 183.3 million (10% y/y increase); wine – USD 180.7 million (41.3% y/y increase); nitrogen fertilizers – USD 137.6 million (5.4% y/y increase); mineral waters – USD 137.1 million (28.4% y/y increase); non-denatured ethyl alcohol and spirits – USD 95.2 million (4.6% y/y decline); medicines – USD 92 million (76.7% y/y increase); bars and rods of iron and steel – USD 63.7 million (1.9% y/y increase).
Oil products remain on top of the list of imports with USD 918.3 million, followed by cars with USD 715 million; hydrocarbons – USD 368.8 million; medicines – USD 314.6 million; mobile and other wireless phones – USD 195.5 million; copper ores and concentrates – USD 165.2 million; wheat – USD 151.7 million; cigarettes – USD 115.4 million; computers – USD 104.1 million; metal construction materials – USD 90.6 million.
This post is also available in: ქართული Русский