Georgia’s Foreign Trade in H1’15

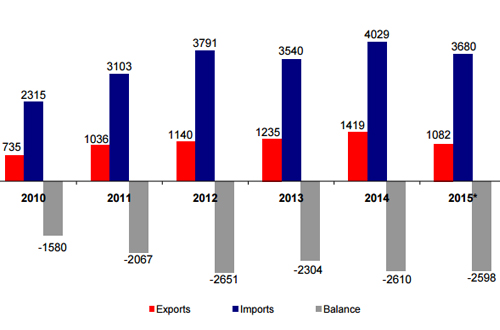
Georgia’s foreign trade figures in January-June of 2010-2015 in million U.S. dollars. Source: Geostat
Georgia’s foreign trade turnover declined 12.6% year-on-year in the first half of 2015 to USD 4.76 billion and the trade gap decreased by 0.4% y/y in the same period to USD 2.6 billion, according to the state statistics office.
Imports were down by 8.6% y/y in January-June to USD 3.68 billion.
Exports from Georgia declined by 23.8% in the first half of 2015, compared to the same period of last year, to slightly over USD 1 billion, caused mainly by reduced re-export of vehicles to Azerbaijan and falling exports of wine and mineral waters to Russia.
Georgia’s trade turnover with the EU-member states reached USD 1.43 billion in the first half of 2015, a 1.8% increase compared to the same period of last year.
Exports to the EU-member states were down by 2% y/y in January-June 2015 to USD 293 million, accounting for 27% of Georgia’s total exports, and imports were up by 3% y/y to USD 1.14 billion, accounting for 31% of country’s total imports.
Trade turnover with Commonwealth of Independent States (CIS) declined by 21% y/y in the first half of 2015 to USD 1.35 billion.
Georgia’s exports to CIS member states declined by 45% y/y to USD 417 million, accounting for 39% of country’s total exports, and imports were down by 2% y/y to USD 939 million, accounting for 26% of Georgia’s total imports.
Turkey remains Georgia’s largest trading partner with the turnover reaching USD 755.7 million in the first half of 2015. Georgian exports to Turkey declined by 2.6% y/y to USD 109.3 million and imports were down by 22% compared to the same period of last year at USD 646.3 million.
Turkey is followed by Azerbaijan with trade turnover of USD 408.6 million in the first half. Georgian exports to Azerbaijan declined by 54.9% y/y to USD 130.7 million, mostly due to decline in re-export of vehicles from USD 147.5 million in January-June of 2014 to USD 41.8 million in the same period of 2015. Imports from Azerbaijan were down by 5.6% y/y to USD 277.8 million.
China was the third largest trading partner with the turnover of USD 370.5 million in the first half of 2015. Export to China increased by 81.3% y/y to USD 55.5 million in the first six months of 2015, mainly because of more than two-fold increase in export of copper ores and concentrates to USD 44 million. Imports from China declined by 10% y/y to USD 315 million in the first half of 2015.
China is followed by Russia with the trade turnover of USD 336.7 million; exports to Russia suffered almost two-fold decline compared to the first six months of last year to USD 70.6 million in the first half of 2015. Imports from Russia increased by 16% y/y to USD 266 million.
Russia is followed by Ukraine with the trade turnover of USD 257.6 million; Germany – USD 239.2 million; Armenia – USD 191.6 million; the United States – USD 181.8 million; Bulgaria – USD 173.6 million; Ireland – USD 146.6 million (this figure is made almost entirely of imports from Ireland as export to the country from Georgia was only at USD 118,600 in the first half of 2015).
Re-export of vehicles no longer leads the pack in Georgia’s total exports, which has suffered almost three-fold decline in the first half of 2015 compared to the same period of last year to USD 99.4 million.
Copper ores and concentrates were on top of the list of exports in the first six months of 2015 with USD 129.6 million, 5.8% y/y decline; followed by ferroalloys – USD 110.4 million (31.3% y/y decline); Georgia exported hazelnut worth of USD 73.6 million in the first half of 2015, which is 2.6-fold increase over the same period of last year; medicines – USD 64.5 million (68.4% y/y increase); nitrogen fertilizers – USD 50.3 million (31.8% y/y decline); mineral waters – USD 45.6 million (37.1% y/y decline); wine – USD 39.8 million (53% y/y decline); crude oil – USD 33.5 million (99.1% y/y increase); raw or semi-processed gold – USD 28.8 million (79.6% y/y increase).
Oil products were on top of the list of imports in the first half of 2015 with USD 305.2 million (26.8% y/y decline); followed by medicines – USD 297.8 million (almost two-fold increase compared to the same period of last year); vehicles – USD 244.1 million (26.4% y/y decline); hydrocarbons – USD 221.9 million (21.9% y/y increase); copper ores and concentrates – USD 109.5 million (17% y/y increase); mobile and other wireless phones – USD 68.1 million (19.6% decline); cigarettes – USD 48.6 million (9.7% y/y increase); wheat – USD 47.6 million (1% y/y increase); non-denatured ethyl alcohol and spirits – USD 30.7 million (25.9% y/y increase); bars and rods of iron and steel – USD 30 million (6.5% y/y increase).
This post is also available in: ქართული Русский